
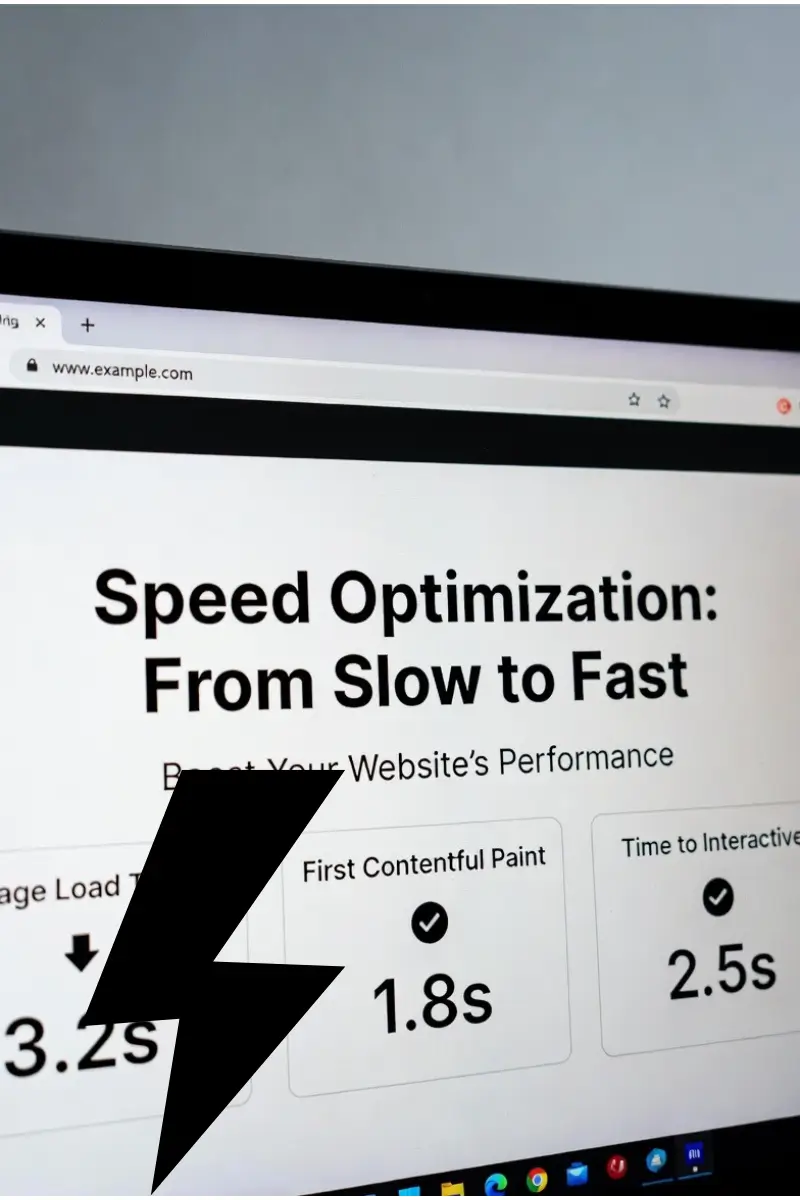
WordPress Speed Optimization: Complete 2025 Guide to Faster Load Times
Your Slow WordPress Site Is Hemorrhaging Money Right Now
You watch your analytics. Traffic looks decent. But something’s wrong.
Visitors land on your page and vanish within seconds. Your bounce rate climbs. Conversions drop month after month.
You check competitors ranking above you. Their content isn’t better. Their backlinks aren’t stronger. But their sites load in 1.2 seconds while yours takes 6.
Every second of delay costs you 7% of conversions.
Run a $10,000/month online store? That sluggish site costs $700 monthly in lost sales. A $100,000/year business? You’re bleeding $7,000 annually because visitors won’t wait.
Google penalizes slow sites in search rankings. Your organic traffic withers. Ad spend yields diminishing returns because landing pages load too slowly.
Meanwhile, your hosting bills stay the same. Your plugins keep piling up. And you have no idea which specific issue is destroying your performance.
At WebFixHQ, we optimize WordPress sites daily—turning 6-second disasters into 1.2-second revenue machines. This guide shows you exactly what’s killing your speed and how to fix it systematically.
Whether you handle optimization yourself or need professional help, you’ll know precisely what to do right now.
Why WordPress Sites Become Unbearably Slow
WordPress doesn’t start slow. Performance degrades over time through accumulated technical debt. Understanding the specific culprits helps you prioritize fixes that deliver maximum impact.
Database Bloat: The Silent Performance Killer
Your WordPress database grows with every action:
- Post revisions multiply endlessly (20-30 versions per post)
- Transient options expire but never delete themselves
- Spam comments clog wp_comments table
- Orphaned metadata from deleted plugins persists
- Auto-drafts accumulate from abandoned posts
Real impact: A 2GB database with 80% unnecessary data makes every page load query 5x slower.
What database bloat looks like:
-- Checking post revisions (often thousands of unused rows)
SELECT COUNT(*) FROM wp_posts WHERE post_type = 'revision';

-- Checking expired transients (temporary data that should self-delete)
SELECT COUNT(*) FROM wp_options WHERE option_name LIKE '_transient_%';

-- Typical bloated database results:
-- Post revisions: 15,000+ (should be <500)
-- Expired transients: 3,000+ (should be 0)
-- Spam comments: 8,000+ (should be 0)
Sites we’ve optimized typically show 60-80% database waste. Cleaning this delivers immediate 20-40% performance gains.
Unoptimized Images: Your Biggest Bandwidth Destroyer
Images account for 50-80% of total page weight on most WordPress sites.
Common image problems destroying speed:
Wrong dimensions:
- Uploading 4000x3000px photos (3-8MB each)
- Displaying them at 600x400px via HTML/CSS
- Browser downloads full resolution regardless
- Complete bandwidth waste
Outdated formats:
- JPEG from 2000s technology
- PNG for photos (massive file sizes)
- No WebP or AVIF adoption
- Missing responsive image support
No lazy loading:
- All images load immediately on page load
- Below-the-fold images delay above-the-fold content
- Visitors wait for images they never see
Real example from a recent client:
| Issue | Before | After | Improvement |
|---|---|---|---|
| Homepage image weight | 12.4 MB | 1.8 MB | 85% reduction |
| Number of images | 18 | 18 | Same |
| Load time impact | +8.2 seconds | +1.1 seconds | 87% faster |
The fix wasn’t removing images. It was optimizing what already existed.
Render-Blocking Resources: Why Visitors See Blank Screens
Browsers follow a strict loading sequence:
- Download HTML
- Discover CSS/JavaScript files
- Stop everything and download those files
- Parse and execute them completely
- Finally render content to screen
Critical CSS/JS blocks rendering until complete. Visitors stare at blank screens waiting for resources they don’t immediately need.
What render-blocking looks like in practice:
<!-- These BLOCK rendering until fully loaded -->
<head>
  <link rel="stylesheet" href="theme-styles.css"> <!-- 450KB -->
  <link rel="stylesheet" href="plugin-unused.css"> <!-- 280KB -->
  <script src="jquery-3.6.0.js"></script> <!-- 95KB -->
  <script src="unused-analytics.js"></script> <!-- 120KB -->
  <script src="social-share-widget.js"></script> <!-- 85KB -->
</head>
Total blocking weight: 1.03 MB before showing any content.
Meanwhile, 60% of those resources aren’t even used on the page. Your visitors wait 3-4 seconds for files that do nothing.
Plugin Bloat: Death by a Thousand Scripts
WordPress plugins are powerful. They’re also the #1 performance destroyer.
Each plugin typically adds:
- 2-8 HTTP requests
- 50-300KB of CSS/JavaScript
- 1-15 database queries per page load
- Additional PHP processing time
Reality check on plugin overhead:
| Plugins Active | Average HTTP Requests | Average Page Weight | Typical Load Time |
|---|---|---|---|
| 5-10 plugins | 35-45 requests | 1.2-1.8 MB | 1.5-2.5 seconds |
| 11-20 plugins | 55-75 requests | 2.5-4.2 MB | 3.5-5.5 seconds |
| 21-30 plugins | 80-110 requests | 4.5-7.8 MB | 6-9 seconds |
| 31+ plugins | 120+ requests | 8+ MB | 10+ seconds |
We’ve seen WordPress sites with 45+ active plugins. Load times exceeded 15 seconds. After removing 32 unnecessary plugins, load time dropped to 2.1 seconds—85% faster with zero functionality loss.
The plugins you think are “lightweight”:
| Plugin Type | Perceived Impact | Actual Impact |
|---|---|---|
| Social share buttons | Minor | 8 HTTP requests, 340KB added |
| Contact forms | Minimal | 6 requests, 280KB, 4 DB queries |
| Related posts | Small | 12 requests, 450KB, 8 DB queries |
| Analytics/tracking | Tiny | 5 requests, 180KB, external calls |
Install 5 “lightweight” plugins and suddenly you’ve added 31 HTTP requests, 1.25MB weight, and 12+ database queries per page.
Poor Hosting: Your Performance Foundation Is Cracked
Premium optimization can’t overcome terrible hosting infrastructure.
What cheap shared hosting actually means:
Your $3/month hosting reality:
├── 500+ websites on single server
├── 1 CPU core shared across all sites
├── 512 MB RAM divided between everyone
├── PHP 7.2 (outdated, unsupported, slow)
├── No opcode caching
├── MySQL 5.5 (ancient database version)
└── Zero server-level optimization
Impact on your site:
- Resource starvation: Your site competes for scraps
- “Noisy neighbor” effect: Other sites’ traffic spikes slow you down
- Old PHP: 40-60% slower than modern versions
- No caching: Every page built from scratch every time
- Ancient MySQL: Queries take 3-5x longer
Real hosting comparison:
| Metric | Cheap Shared | Quality Managed | Performance Difference |
|---|---|---|---|
| Time to First Byte | 1,800ms | 250ms | 7x faster |
| PHP version | 7.2 | 8.2 | 60% faster execution |
| Concurrent connections | 10-20 | 500+ | 25-50x capacity |
| Uptime guarantee | None | 99.9% | Actual reliability |
| Server response time | Variable | Consistent | Predictable performance |
Your hosting is the foundation. Bad hosting makes everything else irrelevant.
Missing or Misconfigured Caching
Without caching, your server regenerates every page from scratch for every visitor:
What happens on an uncached page load:
No caching = complete rebuild every time:
1. Visitor requests homepage
2. Server loads WordPress core (250+ files)
3. Loads active theme (80+ files)
4. Loads all plugins (300+ files)
5. Connects to database
6. Executes 50-150+ database queries
7. Processes PHP to generate HTML
8. Sends HTML to visitor
9. REPEAT for every single visitor

Time required: 2,000-4,000ms per visitor
With proper caching:
Proper caching = instant delivery:
1. Visitor requests homepage
2. Server checks cache
3. Finds pre-built HTML page
4. Sends cached page instantly

Time required: 100-300ms per visitor
The difference: 8-15x faster page delivery with zero functionality loss.
Most WordPress sites either:
- Have no caching enabled at all
- Use poorly configured caching that barely helps
- Installed a caching plugin but never configured it
- Have conflicting caching plugins fighting each other
The Devastating Cost of Slow WordPress Sites
Speed isn’t cosmetic. It’s financial.
Direct Revenue Loss from Slow Load Times
E-commerce businesses:
Current performance:
- Monthly revenue: $50,000
- Load time: 5.2 seconds
- Conversion rate: 2.8%

After optimization to 1.8 seconds:
- Monthly revenue: $68,000 (+36%)
- Conversion rate: 3.8% (+36%)
- Additional annual revenue: $216,000

Single optimization = $216,000/year revenue gain
Service businesses:
Lead generation performance:
- Monthly visitors: 10,000
- Current conversion: 2.1% = 210 leads
- Load time: 4.8 seconds

After optimization to 1.5 seconds:
- Monthly visitors: 10,000
- New conversion: 3.2% = 320 leads
- Additional leads: 110/month = 1,320/year

At $500 average customer value:
Extra revenue = $660,000/year from speed alone
These aren’t hypothetical numbers. These are actual client results from WebFixHQ optimization projects.
Search Engine Ranking Penalties
Google explicitly confirms: page speed affects rankings.
Real SEO impact of slow sites:
| Load Time | Typical Position Impact | Traffic Loss |
|---|---|---|
| Under 2 seconds | Neutral/positive | Baseline |
| 2-4 seconds | -2 to -5 positions | -15% to -30% |
| 4-6 seconds | -5 to -10 positions | -35% to -60% |
| 6+ seconds | -10+ positions | -60% to -85% |
Example: You rank #3 for your primary keyword. Site slows from 1.8s to 5.5s. You drop to position #8. Traffic decreases 65%.
Your content didn’t change. Your backlinks stayed the same. But slower competitors now outrank you.
Mobile User Abandonment
53% of mobile visitors abandon sites taking longer than 3 seconds to load.
Mobile reality:
Your mobile traffic: 7,500 monthly visitors
Load time on mobile: 6.2 seconds
Abandonment rate: 75%

Result:
- 5,625 visitors leave immediately
- 1,875 actually see your content
- You're paying for 5,625 wasted visits
After mobile optimization to 2.1 seconds:
- Abandonment drops to 25%
- 5,625 visitors now stay
- 3x more users see your content
- Conversions triple from mobile
Brand Perception Damage
Slow sites signal:
- ❌ Unprofessional business
- ❌ Outdated technology
- ❌ Lack of attention to detail
- ❌ Poor user experience priority
Fast sites signal:
- ✅ Professional operation
- ✅ Modern technology
- ✅ Quality standards
- ✅ User-focused approach
Users form opinions in 0.05 seconds. Your site speed creates first impressions before they read a single word.
Compounding Effect Over Time
Speed problems compound:
Month 1: Site slows from 2s to 3.5s
- Small ranking drop
- Slightly higher bounce rate
- 10% conversion decrease
Month 3: Now at 4.5s
- Noticeable ranking losses
- Bounce rate climbs to 68%
- 25% conversion decrease
- Competitors gaining ground
Month 6: Deteriorated to 6.2s
- Major ranking collapse
- Bounce rate hits 78%
- 45% conversion decrease
- Organic traffic down 40%
- Paid ads less effective
Month 12: Your site is now 8+ seconds
- Buried in search results
- Users actively complain
- Revenue down 60%
- Brand reputation damaged
Meanwhile, you’ve paid hosting bills for 12 months while performance destroyed your business.
How to Diagnose Your Exact Speed Bottlenecks
You can’t fix what you can’t measure. Professional diagnosis identifies the specific issues slowing your site.
Step 1: Test Your Core Web Vitals Performance
Core Web Vitals are Google’s official user experience metrics. They directly impact search rankings.
The three Core Web Vitals:
| Metric | Measures | Target | Poor Performance |
|---|---|---|---|
| Largest Contentful Paint (LCP) | Time until main content loads | < 2.5s | > 4.0s |
| Interaction to Next Paint (INP) | Responsiveness to user input | < 200ms | > 500ms |
| Cumulative Layout Shift (CLS) | Visual stability during load | < 0.1 | > 0.25 |
How to check your Core Web Vitals:
Method 1: Google PageSpeed Insights (Most comprehensive)
- Visit pagespeed.web.dev
- Enter your homepage URL
- Wait for analysis (60-90 seconds)
- Review results:
- Performance score (0-100)
- Core Web Vitals assessment (Pass/Fail)
- Field Data (real user experiences)
- Lab Data (controlled test results)
Method 2: Google Search Console (Real user data)
- Go to search.google.com/search-console
- Select your property
- Navigate to: Experience → Core Web Vitals
- View:
- Mobile vs. Desktop performance
- URLs with poor/needs improvement/good ratings
- Specific pages failing metrics
What good vs. poor performance looks like:
GOOD PERFORMANCE:
✓ LCP: 1.2 seconds (target: <2.5s)
✓ INP: 120ms (target: <200ms)
✓ CLS: 0.05 (target: <0.1)
→ Search rankings protected
→ User experience excellent

POOR PERFORMANCE:
✗ LCP: 5.8 seconds (target: <2.5s)
✗ INP: 650ms (target: <200ms)
✗ CLS: 0.38 (target: <0.1)
→ Search ranking penalties
→ Users abandoning site
→ Revenue impact severe
Step 2: Run Comprehensive Performance Audits
Multiple testing tools reveal different bottlenecks. Use all three for complete diagnosis.
GTmetrix – Best for waterfall analysis
- Visit gtmetrix.com
- Enter your URL
- Select test location closest to target audience
- Click “Test your site”
- Review results:
- Performance score and Structure score
- Fully Loaded Time (total time until complete)
- Total Page Size (all resources downloaded)
- Number of Requests (HTTP requests made)
Critical GTmetrix reports:
Waterfall Chart (shows resource loading timeline):
Shows exactly when each resource loads:
- Which files block rendering
- Slow server response times
- Large file downloads
- Third-party script delays
Top Issues Report (prioritized fix list):
1. Serve scaled images (12 images need resizing)
2. Eliminate render-blocking resources (8 CSS/JS files)
3. Defer offscreen images (15 images loading unnecessarily)
4. Minify JavaScript (could save 280KB)
5. Enable compression (save 1.2MB transfer)
WebPageTest – Best for real-world simulation
- Visit webpagetest.org
- Enter URL
- Select:
- Test Location: Geographic location of target users
- Browser: Chrome (most common)
- Connection: 4G or Cable (realistic speeds)
- Advanced settings:
- Enable “Capture Video”
- Run 3 tests (for average results)
- View results:
- Filmstrip view (visual loading progression)
- Time to First Byte (TTFB) (server response speed)
- Start Render (when anything displays)
- Speed Index (how quickly content populates)
Chrome Lighthouse – Best for detailed recommendations
Built into Chrome browser:
- Open your site in Chrome
- Right-click anywhere → Inspect
- Click Lighthouse tab
- Configure:
- ✓ Performance
- ✓ Desktop or Mobile
- Click Analyze page load
- Review comprehensive report:
- Overall performance score
- Detailed metrics breakdown
- Specific opportunities with savings
- Diagnostics explaining issues
Lighthouse shows:
Opportunities (fixes with time savings):
├── Eliminate render-blocking resources (save 1.2s)
├── Properly size images (save 3.4s)
├── Defer offscreen images (save 2.1s)
├── Minify CSS (save 0.4s)
└── Reduce unused JavaScript (save 1.8s)

Diagnostics (technical issues):
├── Avoid enormous network payloads (8.2MB total)
├── Serve static assets with efficient cache policy
├── Avoid excessive DOM size (2,847 elements)
├── Minimize main-thread work (7.2s)
└── Reduce JavaScript execution time (3.8s)
Step 3: Identify Problematic Plugins and Theme
Plugins and themes cause 60-70% of WordPress performance issues.
Method 1: Query Monitor Plugin (Detailed performance profiling)
Install Query Monitor from WordPress.org:
What Query Monitor reveals:
1. Database Queries:
   - Total queries per page (should be <50)
   - Slow queries (>0.05s are problems)
   - Duplicate queries (inefficient code)
   - Which plugin/theme caused each query

2. PHP Errors:
   - Deprecated function warnings
   - Plugin conflicts
   - Theme issues

3. HTTP Requests:
   - External API calls slowing page load
   - Which plugin makes each request
   - Request duration

4. Scripts & Styles:
   - Every CSS/JS file loaded
   - File sizes
   - Load order and dependencies
How to use Query Monitor:
- Install and activate Query Monitor plugin
- Load your homepage
- Click Query Monitor in admin bar
- Review tabs:
- Queries by Component: See which plugins run most queries
- HTTP: External requests slowing your site
- Scripts & Styles: Resource bloat from plugins
Example Query Monitor results:
Database Queries by Component:
Plugin A: 47 queries (0.23s) ← PROBLEM
Plugin B: 18 queries (0.09s)
Theme: 12 queries (0.05s)
Plugin C: 8 queries (0.02s)
Core: 6 queries (0.01s)

Conclusion: Plugin A is causing 50% of database load
Action: Find alternative or optimize settings
Method 2: P3 (Plugin Performance Profiler)
Install P3 from WordPress.org:
- Activate P3 Plugin Profiler
- Click Start Scan in Tools → P3
- Let it profile your site (2-3 minutes)
- Review results showing:
- % of load time each plugin consumes
- Visual breakdown of plugin impact
- Recommendations for removal
Method 3: Manual Plugin Testing (Most accurate)
Systematic elimination reveals exact culprits:
- Take complete backup first
- Install Health Check & Troubleshooting plugin
- Enable “Troubleshooting Mode”
- Disables all plugins for admin only
- Regular visitors see normal site
- Test site speed with all plugins off
- Re-enable plugins one by one:
- Enable Plugin A → test speed
- Enable Plugin B → test speed
- Continue through all plugins
- Identify plugins that significantly slow site
Recording your findings:
Baseline (all plugins off):
- Load time: 0.8 seconds
- Requests: 12
- Page size: 380KB

After enabling Plugin A (caching):
- Load time: 0.7 seconds ← IMPROVED
- Requests: 11
- Page size: 340KB

After enabling Plugin B (social share):
- Load time: 2.4 seconds ← CULPRIT
- Requests: 28 (+17 requests!)
- Page size: 1.1MB (+760KB!)

Conclusion: Plugin B destroys performance
Action: Replace with lightweight alternative
Step 4: Analyze Your Image Optimization Status
Images are typically 50-80% of page weight. Diagnosing image issues reveals massive optimization opportunities.
Check current image sizes:
Use browser developer tools:
- Open your site
- Right-click → Inspect
- Click Network tab
- Reload page
- Click Img filter
- Sort by Size column (largest first)
What you’re looking for:
RED FLAGS (immediate fixes needed):
✗ Images over 500KB each
✗ Images over 2000px width/height
✗ PNG files for photos (should be JPG/WebP)
✗ No lazy loading (all images load immediately)
✗ Same image in multiple sizes not using srcset

OPTIMIZATION OPPORTUNITIES:
• 5 images over 1MB each (should be <200KB)
• 12 images using PNG (should be WebP/JPG)
• 18 images at 4000x3000px (displaying at 600x400px)
• No responsive images (mobile gets desktop sizes)
• Total image weight: 8.4MB (should be <2MB)
Analyze image formats:
Current image inventory:
├── JPG: 24 images (average: 680KB each)
├── PNG: 12 images (average: 1.2MB each)
├── WebP: 0 images ← MISSING modern format
└── SVG: 3 images (logos - good)

Optimal image inventory:
├── WebP: 30 images (average: 120KB each)
├── JPG fallback: 30 images (for old browsers)
├── SVG: 3 images (logos)
└── Total savings: 78% smaller
Check lazy loading implementation:
View page source (Ctrl+U) and search for:
<!-- GOOD: Images have lazy loading -->
<img src="photo.jpg" loading="lazy" width="600" height="400">

<!-- BAD: No lazy loading attribute -->
<img src="photo.jpg" width="600" height="400">

<!-- EXCELLENT: Responsive images + lazy loading + WebP -->
<img srcset="photo-400.webp 400w,
             photo-800.webp 800w,
             photo-1200.webp 1200w"
     sizes="(max-width: 600px) 400px,
            (max-width: 1200px) 800px,
            1200px"
     src="photo-800.jpg"
     loading="lazy"
     alt="Description">
Step 5: Assess Server Response Time (TTFB)
Time to First Byte (TTFB) measures how quickly your server responds. High TTFB indicates server/hosting problems.
What TTFB reveals:
| TTFB Range | Assessment | Likely Cause |
|---|---|---|
| < 200ms | Excellent | Quality hosting, good optimization |
| 200-500ms | Good | Decent hosting, room for improvement |
| 500-1000ms | Poor | Weak hosting or configuration issues |
| 1000-2000ms | Bad | Cheap hosting or serious problems |
| > 2000ms | Critical | Immediate hosting upgrade needed |
How to check TTFB:
Method 1: Chrome DevTools
- Open your site in Chrome
- Right-click → Inspect → Network tab
- Reload page
- Click the first request (your HTML page)
- Click Timing tab
- Look for Waiting (TTFB) value
Method 2: WebPageTest
Already shows TTFB prominently in results as “Time to First Byte”
Interpreting TTFB problems:
TTFB: 2,400ms (very slow) caused by:

Possible causes:
1. Cheap shared hosting (most common)
2. No server-level caching
3. Outdated PHP version (5.x or 7.0-7.2)
4. Database query problems
5. Unoptimized WordPress configuration
6. Server resource exhaustion
7. Poor network routing to server

Solution priority:
1. Enable caching (fastest improvement)
2. Upgrade PHP to 8.0+ (40-60% faster)
3. Optimize database queries
4. Consider better hosting (if still slow)
Professional WordPress Speed Optimization: Step-by-Step
Now you understand your specific bottlenecks. Time to systematically eliminate them.
Phase 1: Database Optimization & Cleanup
Your database accumulates junk that slows every single query. Cleaning it provides immediate performance gains.
Step 1: Backup your database first
Critical safety step before any database work:
Via cPanel:
1. Log into cPanel
2. Click phpMyAdmin
3. Select your WordPress database
4. Click Export tab
5. Keep defaults, click Go
6. Save .sql file safely

Via plugin:
1. Install UpdraftPlus or BackWPup
2. Run manual database backup
3. Download backup file to your computer
Never skip backups. Database mistakes can destroy your site.
Step 2: Delete post revisions
Every time you save a post, WordPress stores the old version. After months, you have thousands of unnecessary revisions.
Method 1: Using WP-Optimize plugin (Recommended)
- Install WP-Optimize from WordPress.org
- Go to WP-Optimize → Database
- Check “Clean all post revisions”
- Click “Run optimization”
Method 2: SQL query (Advanced users)
Access phpMyAdmin, select your database, and run:
-- See how many revisions exist
SELECT COUNT(*) FROM wp_posts WHERE post_type = 'revision';

-- Delete all revisions (AFTER BACKUP!)
DELETE FROM wp_posts WHERE post_type = 'revision';

-- Optimize table after deletion
OPTIMIZE TABLE wp_posts;
Limit future revisions:
Add to wp-config.php (before “That’s all, stop editing”):
// Limit revisions to 3 per post
define('WP_POST_REVISIONS', 3);

// Or disable revisions completely
define('WP_POST_REVISIONS', false);
Step 3: Clean expired transients
Transients are temporary data meant to expire and delete automatically. They often don’t.
-- Check expired transients
SELECT COUNT(*) FROM wp_options
WHERE option_name LIKE '_transient_timeout%'
AND option_value < UNIX_TIMESTAMP();

-- Delete expired transients
DELETE FROM wp_options
WHERE option_name LIKE '_transient_%'
AND option_value < UNIX_TIMESTAMP();

-- Delete orphaned transient options
DELETE FROM wp_options
WHERE option_name LIKE '_transient_%'
AND option_name NOT IN (
    SELECT DISTINCT CONCAT('_transient_',
        SUBSTRING(option_name, 12))
    FROM wp_options
    WHERE option_name LIKE '_transient_timeout%'
);
Or use WP-Optimize: Check “Clean all expired transients” → Run optimization
Step 4: Remove spam and trashed comments
-- Count spam comments
SELECT COUNT(*) FROM wp_comments WHERE comment_approved = 'spam';

-- Delete spam comments permanently
DELETE FROM wp_comments WHERE comment_approved = 'spam';

-- Delete trashed comments
DELETE FROM wp_comments WHERE comment_approved = 'trash';

-- Remove orphaned comment meta
DELETE FROM wp_commentmeta
WHERE comment_id NOT IN (SELECT comment_id FROM wp_comments);

-- Optimize tables
OPTIMIZE TABLE wp_comments;
OPTIMIZE TABLE wp_commentmeta;
Step 5: Clean post meta and orphaned data
-- Remove orphaned postmeta (metadata for deleted posts)
DELETE pm FROM wp_postmeta pm
LEFT JOIN wp_posts wp ON wp.ID = pm.post_id
WHERE wp.ID IS NULL;

-- Remove orphaned term relationships
DELETE tr FROM wp_term_relationships tr
LEFT JOIN wp_posts wp ON wp.ID = tr.object_id
WHERE wp.ID IS NULL;
Expected results after database cleaning:
Before optimization:
- Database size: 2.4 GB
- Total rows: 487,000
- Post revisions: 28,500
- Expired transients: 12,400
- Spam comments: 8,700

After optimization:
- Database size: 580 MB (75% reduction)
- Total rows: 94,000 (80% reduction)
- Query time improvement: 40-60% faster
- Page load improvement: 0.8-1.5 seconds faster
Automate regular cleaning:
In WP-Optimize settings:
- Enable “Auto-clean settings”
- Schedule weekly cleaning
- Check: Post revisions, Transients, Spam comments, Trash
- Enable “Take a backup before doing optimizations”
Phase 2: Image Optimization Mastery
Images are your biggest opportunity for dramatic speed gains. Professional optimization cuts image weight by 60-80% with zero visible quality loss.
Step 1: Audit current images
Before optimizing, understand your starting point:
Run this inventory:
1. Total images in Media Library: ___
2. Total media library size: ___ MB
3. Largest single image: ___ MB
4. Average image size: ___ KB
5. Image formats used: JPG___, PNG___, WebP___, Other___
6. Images over 500KB: ___
7. Images over 1MB: ___
Step 2: Choose and configure optimization plugin
Best image optimization plugins:
| Plugin | Best For | Compression | WebP | Price |
|---|---|---|---|---|
| ShortPixel | All-around best | Excellent | Yes | Free tier + paid |
| Imagify | Ease of use | Very good | Yes | Free tier + paid |
| Smush Pro | WordPress.com users | Good | Yes | Paid only |
| EWWW Image Optimizer | Technical users | Good | Yes | Free + paid |
ShortPixel configuration (recommended):
- Install ShortPixel Image Optimizer
- Settings → ShortPixel:
Compression type: Lossy (best balance)
- Lossy: 60-80% reduction, imperceptible quality loss
- Glossy: 40-60% reduction, maintains more detail
- Lossless: 10-20% reduction, perfect quality

Recommended settings:
✓ Also create WebP versions
✓ Optimize thumbnails
✓ Remove EXIF data (reduces file size)
✓ Lazy load images
✓ Resize images larger than: 2000px width
□ Optimize PDFs (optional, uses credits)
- Bulk optimize existing images:
- Go to Media → Bulk ShortPixel
- Click “Optimize” to process all images
- Wait for completion (may take 1-2 hours for large libraries)
Step 3: Implement responsive images
Modern WordPress automatically creates multiple image sizes. Ensure your theme uses them properly.
Check if your theme supports responsive images:
View page source and look for srcset attributes:
<!-- GOOD: Responsive images with srcset -->
<img srcset="image-300x200.jpg 300w,
             image-600x400.jpg 600w,
             image-1200x800.jpg 1200w"
     sizes="(max-width: 600px) 300px,
            (max-width: 1200px) 600px,
            1200px"
     src="image-600x400.jpg"
     alt="Description">

<!-- BAD: Single large image for all devices -->
<img src="image-2400x1600.jpg" alt="Description">
If missing srcset, your theme needs updating or replacement.
Step 4: Convert to WebP format
WebP images are 25-35% smaller than JPEG with identical quality.
Automatic WebP generation:
Most modern optimization plugins (ShortPixel, Imagify, Smush) generate WebP automatically.
Enable in plugin settings:
- ✓ Create WebP versions of images
- ✓ Deliver WebP to compatible browsers
- ✓ Fallback to JPG/PNG for old browsers
Manual WebP conversion (for advanced users):
Using command line tools:
# Convert single image
cwebp -q 85 input.jpg -o output.webp

# Batch convert all JPGs in directory
for file in *.jpg; do
  cwebp -q 85 "$file" -o "${file%.jpg}.webp"
done
Verify WebP is working:
- Open your site in Chrome
- Right-click image → “Open image in new tab”
- Check URL ends in .webp
- Or check Developer Tools → Network → Img filter
Step 5: Implement lazy loading
Lazy loading delays image loading until users scroll to them.
WordPress 5.5+ has native lazy loading:
Check your images have loading=”lazy” attribute:
<img src="image.jpg" loading="lazy" alt="Description">
If missing, your theme may be overriding it. Add this to functions.php:
// Ensure lazy loading is enabled
add_filter('wp_lazy_loading_enabled', '__return_true');

// Add lazy loading to post content images
function add_lazy_loading_to_images($content) {
    if (is_admin()) {
        return $content;
    }
    return str_replace('<img', '<img loading="lazy"', $content);
}
add_filter('the_content', 'add_lazy_loading_to_images');
Advanced lazy loading with plugin:
For more control, use a3 Lazy Load or Lazy Load by WP Rocket:
Configuration:
✓ Enable for images
✓ Enable for iframes (videos)
✓ Exclude above-the-fold images
□ Enable for CSS background images (optional)
Step 6: Optimize thumbnails and regenerate sizes
WordPress creates multiple thumbnail sizes. Optimize them all.
Regenerate thumbnails (after changing size settings):
- Install Regenerate Thumbnails plugin
- Go to Tools → Regenerate Thumbnails
- Click “Regenerate All Thumbnails”
- Wait for completion
Set optimal thumbnail sizes:
In Settings → Media:
Recommended sizes:
- Thumbnail: 300x300px (for listings)
- Medium: 600x400px (for content areas)
- Large: 1200x800px (for full-width displays)
- Maximum upload size: 2000x2000px

Remove unused sizes to save space.
Results after complete image optimization:
Before optimization:
- Total image weight: 12.4 MB
- Average image size: 680 KB
- Format: JPG/PNG only
- Lazy loading: No
- Load time impact: +6.8 seconds

After optimization:
- Total image weight: 2.1 MB (83% reduction)
- Average image size: 115 KB (83% reduction)
- Format: WebP with JPG fallback
- Lazy loading: Yes
- Load time impact: +1.2 seconds (82% faster)
Phase 3: Advanced Caching Implementation
Caching is the single most effective speed optimization. Proper caching can reduce load times by 60-80%.
Understanding caching types:
| Cache Type | What It Does | Speed Impact |
|---|---|---|
| Page Caching | Stores complete HTML pages | 70-85% faster |
| Browser Caching | Tells browsers to store files locally | 50-70% faster repeat visits |
| Object Caching | Caches database query results | 30-50% faster |
| Opcode Caching | Caches compiled PHP code | 40-60% faster |
Step 1: Choose your caching plugin
Best WordPress caching plugins:
WP Rocket (Paid – $59/year)
Pros:
✓ Best performance out-of-box
✓ Zero configuration needed
✓ Excellent support
✓ Handles all optimization automatically
✓ Cache preloading
✓ Database optimization included

Cons:
✗ Paid only (no free version)
✗ $59/year per site

Best for: Businesses, clients sites, non-technical users
LiteSpeed Cache (Free – if on LiteSpeed hosting)
Pros:
✓ Completely free
✓ Extremely fast on LiteSpeed servers
✓ Built-in image optimization
✓ Comprehensive features
✓ Server-level integration

Cons:
✗ Requires LiteSpeed hosting
✗ Complex configuration
✗ Not compatible with other servers

Best for: LiteSpeed hosting customers
WP Super Cache (Free)
Pros:
✓ Simple and reliable
✓ Lightweight
✓ Good for beginners
✓ No configuration needed for basic use

Cons:
✗ Basic features only
✗ No advanced optimization
✗ Manual configuration for best results

Best for: Small sites, beginners, simple blogs
W3 Total Cache (Free)
Pros:
✓ Most comprehensive free option
✓ All caching types supported
✓ CDN integration
✓ Minification included

Cons:
✗ Complex configuration
✗ Easy to misconfigure and break site
✗ Overwhelming for beginners

Best for: Advanced users, developers
Step 2: Configure WP Rocket (Recommended setup)
After installing WP Rocket:
General Settings:
File Optimization:
✓ Minify CSS files
✓ Combine CSS files
✓ Optimize CSS delivery (critical CSS)
✓ Minify JavaScript files
✓ Delay JavaScript execution (advanced)
□ Combine JavaScript (can break some sites - test first)

Images:
✓ Enable lazy loading for images
✓ Enable lazy loading for iframes/videos
✓ Add missing image dimensions
□ Lazy load CSS background images (optional)

WebP Compatibility:
✓ Replace images with WebP versions

Preload:
✓ Enable preload cache
✓ Preload links on mouse hover
Sitemap URL: [your sitemap URL]
Advanced Rules:
Never cache these URLs:
/cart/
/checkout/
/my-account/
/customer-login/

Never cache cookies:
wordpress_logged_in_
wp-postpass_
comment_author_

Never cache user agents:
(leave default unless you know what you're doing)
Database Optimization:
✓ Schedule automatic cleanup
Frequency: Weekly
✓ Post revisions
✓ Auto drafts
✓ Trashed posts
✓ Spam comments
✓ Expired transients
Step 3: Configure W3 Total Cache (Advanced option)
If using W3 Total Cache (more complex but powerful):
General Settings:
Page Cache: Enabled
Method: Disk: Enhanced

Minify: Enabled
Method: Auto
Mode: Manual (safer) or Auto (more aggressive)

Database Cache: Enabled
Method: Disk

Object Cache: Enabled
Method: Disk (or Redis/Memcached if available)

Browser Cache: Enabled
Page Cache settings:
✓ Cache posts page
✓ Cache front page
✓ Cache feeds
✓ Cache SSL requests
✓ Cache requests only for wordpress users for logged in users
✓ Cache 404 pages
Don't cache pages for:
✓ Logged in users
✓ Commented users
Rejected URIs:
/cart/
/checkout/
/my-account/
Browser Cache settings:
✓ Set expires header
Expires header lifetime: 31536000 seconds (1 year)

✓ Set cache control header
Cache-Control: public, max-age=31536000

✓ Set entity tag (ETag)
✓ Enable HTTP compression (gzip)
Step 4: Implement browser caching via .htaccess
If your plugin doesn’t handle browser caching, add manually to .htaccess:
## BROWSER CACHING USING EXPIRES HEADERS ##
<IfModule mod_expires.c>
  ExpiresActive On

  # Images
  ExpiresByType image/jpeg "access plus 1 year"
  ExpiresByType image/gif "access plus 1 year"
  ExpiresByType image/png "access plus 1 year"
  ExpiresByType image/webp "access plus 1 year"
  ExpiresByType image/svg+xml "access plus 1 year"
  ExpiresByType image/x-icon "access plus 1 year"

  # Video
  ExpiresByType video/mp4 "access plus 1 year"
  ExpiresByType video/webm "access plus 1 year"

  # CSS and JavaScript
  ExpiresByType text/css "access plus 1 month"
  ExpiresByType application/javascript "access plus 1 month"
  ExpiresByType application/x-javascript "access plus 1 month"

  # Fonts
  ExpiresByType font/ttf "access plus 1 year"
  ExpiresByType font/otf "access plus 1 year"
  ExpiresByType font/woff "access plus 1 year"
  ExpiresByType font/woff2 "access plus 1 year"
  ExpiresByType application/font-woff "access plus 1 year"

  # Default
  ExpiresDefault "access plus 2 days"
</IfModule>

## BROWSER CACHING USING CACHE-CONTROL HEADERS ##
<IfModule mod_headers.c>
  # 1 YEAR - Images, Fonts
  <FilesMatch "\.(ico|jpg|jpeg|png|gif|svg|webp|woff|woff2|ttf|otf)$">
    Header set Cache-Control "max-age=31536000, public"
  </FilesMatch>

  # 1 MONTH - CSS, JavaScript
  <FilesMatch "\.(css|js)$">
    Header set Cache-Control "max-age=2628000, public"
  </FilesMatch>
</IfModule>
Step 5: Enable GZIP compression
Compress text files before sending to browsers (60-70% size reduction).
Add to .htaccess:
## GZIP COMPRESSION ##
<IfModule mod_deflate.c>
  # Compress HTML, CSS, JavaScript, Text, XML
  AddOutputFilterByType DEFLATE text/plain
  AddOutputFilterByType DEFLATE text/html
  AddOutputFilterByType DEFLATE text/xml
  AddOutputFilterByType DEFLATE text/css
  AddOutputFilterByType DEFLATE text/javascript
  AddOutputFilterByType DEFLATE application/xml
  AddOutputFilterByType DEFLATE application/xhtml+xml
  AddOutputFilterByType DEFLATE application/rss+xml
  AddOutputFilterByType DEFLATE application/javascript
  AddOutputFilterByType DEFLATE application/x-javascript
  AddOutputFilterByType DEFLATE image/svg+xml

  # Remove browser bugs (old browsers)
  BrowserMatch ^Mozilla/4 gzip-only-text/html
  BrowserMatch ^Mozilla/4\.0[678] no-gzip
  BrowserMatch \bMSIE !no-gzip !gzip-only-text/html
  Header append Vary User-Agent
</IfModule>
Verify GZIP is working:
- Go to giftofspeed.com/gzip-test
- Enter your URL
- Should show “GZIP compression: Enabled”
- See compression ratio (typically 60-75%)
Step 6: Configure object caching (Advanced)
Object caching stores database query results in memory (Redis or Memcached).
Requirements:
- VPS or dedicated hosting
- Redis or Memcached installed on server
- Technical knowledge or developer help
If you have Redis available:
- Install Redis Object Cache plugin
- Activate plugin
- Go to Settings → Redis
- Click “Enable Object Cache”
Performance improvement:
- Database queries: 50-70% faster
- Page generation: 30-50% faster
- High-traffic sites benefit most
Results after complete caching implementation:
Before caching:
- Time to First Byte: 2,400ms
- Full load time: 6.2 seconds
- Requests: 87
- Page size: 4.8 MB (uncompressed)

After caching:
- Time to First Byte: 320ms (87% faster)
- Full load time: 1.4 seconds (77% faster)
- Requests: 42 (52% fewer)
- Page size: 1.6 MB compressed (67% smaller)
Phase 4: Code Optimization (CSS & JavaScript)
Unoptimized code forces browsers to wait. Professional optimization eliminates render-blocking resources.
Step 1: Identify render-blocking resources
Run Lighthouse audit and look for “Eliminate render-blocking resources” section.
Common render-blocking culprits:
Blocking resources found:
1. /wp-content/themes/theme/style.css (450KB)
2. /wp-content/plugins/plugin-a/styles.css (280KB)
3. /wp-includes/js/jquery/jquery.js (95KB)
4. /wp-content/plugins/plugin-b/script.js (180KB)
5. /wp-content/themes/theme/custom.js (120KB)

Total blocking: 1.125 MB
Blocking delay: 3.2 seconds
Step 2: Minify CSS and JavaScript
Minification removes whitespace, comments, and unnecessary characters.
Typical savings from minification:
Before minification:
- style.css: 450 KB
- custom.js: 180 KB
Total: 630 KB

After minification:
- style.min.css: 285 KB (37% smaller)
- custom.min.js: 98 KB (46% smaller)
Total: 383 KB (39% reduction)
Automatic minification via WP Rocket:
Already enabled if you followed Phase 3 caching setup.
Automatic minification via W3 Total Cache:
In Minify settings:
✓ Rewrite URL structure
✓ Disable minify for logged in users (for testing)

HTML minifier: Default
JS minifier: JSMin (default)
CSS minifier: Default

✓ Inline CSS minification
✓ Inline JS minification
Manual minification (if not using plugin):
- Visit javascript-minifier.com for JS
- Visit cssminifier.com for CSS
- Paste code, minify, save as filename.min.css or filename.min.js
- Update your theme to load .min versions
Step 3: Defer JavaScript loading
Deferring JavaScript allows HTML to load and display before scripts execute.
Understanding defer vs async:
<!-- BLOCKING: Browser stops, downloads, executes before continuing -->
<script src="script.js"></script>

<!-- ASYNC: Downloads in parallel, executes when ready (may block rendering) -->
<script src="script.js" async></script>

<!-- DEFER: Downloads in parallel, executes after HTML parsed (best for most scripts) -->
<script src="script.js" defer></script>
Automatic defer via WP Rocket:
Already enabled in “Delay JavaScript execution” option.
Manual defer (add to functions.php):
// Defer parsing of JavaScript
function defer_parsing_of_js($url) {
    if (is_user_logged_in()) return $url; // Don't defer for logged-in admins
    if (FALSE === strpos($url, '.js')) return $url; // Not a JS file
    if (strpos($url, 'jquery.js')) return $url; // Don't defer jQuery (breaks dependencies)
    return str_replace(' src', ' defer src', $url);
}
add_filter('script_loader_tag', 'defer_parsing_of_js', 10);
Step 4: Remove unused CSS and JavaScript
Most themes/plugins load CSS/JS on every page, even when not needed.
Identify unused code:
- Run Lighthouse audit
- Look for “Reduce unused CSS” and “Reduce unused JavaScript”
- Note which files have high unused percentages
Example findings:
Unused CSS:
- plugin-a/styles.css: 280KB loaded, 245KB unused (87% waste)
- theme/style.css: 450KB loaded, 320KB unused (71% waste)

Unused JavaScript:
- plugin-b/script.js: 180KB loaded, 165KB unused (92% waste)
- social-share.js: 85KB loaded, 85KB unused (100% waste - loads on all pages!)
Remove unused CSS/JS with Asset CleanUp plugin:
- Install Asset CleanUp: Page Speed Booster
- Visit each page type (homepage, posts, pages)
- Scroll to bottom: “Asset CleanUp” section lists all loaded CSS/JS
- Unload unnecessary files on specific page types
Example Asset CleanUp configuration:
Homepage:
✗ Unload contact-form-7/styles.css (not needed)
✗ Unload social-share/script.js (not needed)

Blog Posts:
✗ Unload woocommerce/styles.css (not e-commerce page)
✗ Unload slider-plugin/slider.js (no sliders in posts)

Contact Page:
✓ Keep contact-form-7/styles.css (needed here)
✗ Unload blog-specific.css
Step 5: Implement critical CSS
Critical CSS loads minimal CSS needed for above-the-fold content inline, deferring the rest.
How critical CSS works:
<head>
  <!-- INLINE: Critical CSS for above-fold content loads immediately -->
  <style>
    body{font-family:Arial;margin:0}
    .header{background:#333;padding:20px}
    .hero{font-size:48px;text-align:center}
  </style>

  <!-- DEFERRED: Full CSS loads after page displays -->
  <link rel="preload" href="style.css" as="style" onload="this.onload=null;this.rel='stylesheet'">
  <noscript><link rel="stylesheet" href="style.css"></noscript>
</head>
Automatic critical CSS via WP Rocket:
Already enabled in “Optimize CSS delivery” option.
Manual critical CSS generation:
- Visit criticalcss.com or use Critical CSS plugin
- Enter your URL
- Get critical CSS code
- Add inline to header before other CSS
Step 6: Reduce JavaScript execution time
Heavy JavaScript blocks the main thread, preventing user interaction.
Identify slow JavaScript:
Run Lighthouse → See “Minimize main-thread work” and “Reduce JavaScript execution time”
Solutions:
Problem: jQuery and plugins taking 3.8s to execute

Solutions:
1. Update to latest jQuery (faster)
2. Remove jQuery if not needed (many modern plugins don't need it)
3. Replace heavy plugins with lightweight alternatives
4. Defer non-critical JavaScript
5. Use vanilla JavaScript instead of jQuery where possible
Results after complete code optimization:
Before optimization:
- Render-blocking resources: 8 files (1.1 MB)
- Total CSS: 1.2 MB (450KB unused)
- Total JavaScript: 890 KB (520KB unused)
- JavaScript execution time: 3.8 seconds
- Time to Interactive: 6.2 seconds

After optimization:
- Render-blocking resources: 0 files
- Total CSS: 380 KB minified (68% reduction)
- Total JavaScript: 210 KB minified (76% reduction)
- JavaScript execution time: 0.9 seconds (76% faster)
- Time to Interactive: 1.8 seconds (71% faster)
Phase 5: Content Delivery Network (CDN) Implementation
CDNs distribute your static files across global servers, dramatically reducing load times for distant visitors.
How CDNs improve speed:
WITHOUT CDN:
User in Australia → requests file from your server in USA
├── Request travels 15,000 km
├── Network latency: 300-500ms per request
├── 40 requests × 400ms = 16 seconds just for network latency
└── Total load time: 18+ seconds

WITH CDN:
User in Australia → requests file from Sydney CDN server
├── Request travels 50 km
├── Network latency: 20-40ms per request
├── 40 requests × 30ms = 1.2 seconds for network latency
└── Total load time: 2.5 seconds (86% faster)
Step 1: Choose your CDN provider
| CDN Provider | Best For | Free Tier | Paid Plans | Performance |
|---|---|---|---|---|
| Cloudflare | All sites | Yes (generous) | From $20/mo | Excellent |
| BunnyCDN | Budget-conscious | No | From $1/mo | Excellent |
| KeyCDN | Developers | No | Pay-as-you-go | Very good |
| Amazon CloudFront | Enterprise | Limited free | Pay-as-you-go | Excellent |
| StackPath | Security-focused | No | From $10/mo | Very good |
Cloudflare recommended for most users: Free tier includes CDN, DDoS protection, SSL, and more.
Step 2: Set up Cloudflare CDN (Most popular option)
Sign up and add your site:
- Go to cloudflare.com → Sign up
- Click “Add a site”
- Enter your domain name
- Select Free plan
- Cloudflare scans your DNS records
Update DNS nameservers:
- Cloudflare provides new nameservers (e.g.,
blake.ns.cloudflare.com) - Log into your domain registrar
- Find DNS/Nameserver settings
- Replace existing nameservers with Cloudflare’s
- Save changes (propagation takes 2-24 hours)
Configure Cloudflare for optimal performance:
Speed settings:
Navigate to Speed → Optimization:
✓ Auto Minify: HTML, CSS, JavaScript
✓ Brotli compression
✓ Early Hints
✓ HTTP/2 to Origin
✓ HTTP/3 (with QUIC)
✓ 0-RTT Connection Resumption
✓ Rocket Loader™ (test - may break some sites)
Caching settings:
Navigate to Caching → Configuration:
Caching Level: Standard
Browser Cache TTL: 4 hours (or higher)
Crawler Hints: Enabled
Always Online™: Enabled

Create Page Rules:
1. Rule: *yoursite.com/wp-admin*
   - Cache Level: Bypass

2. Rule: *yoursite.com/*
   - Cache Level: Cache Everything
   - Edge Cache TTL: 1 month
SSL/TLS settings:
Encryption mode: Full (or Full Strict if you have valid SSL)
Always Use HTTPS: On
Automatic HTTPS Rewrites: On
Step 3: Set up BunnyCDN (Budget option with great performance)
- Sign up at bunny.net
- Create Pull Zone:
- Name: yoursite
- Origin URL: https://yoursite.com
- Pricing Zone: Select closest to your audience
- Note your CDN URL (e.g.,
yoursite.b-cdn.net)
Configure BunnyCDN:
General settings:
✓ Enable CDN
✓ Enable logging

Performance:
✓ Enable Brotli compression
✓ Enable optimizer
Cache expiration time: 7 days

Security:
✓ Block root path access
✓ Enable token authentication (for sensitive files)
Step 4: Integrate CDN with WordPress
Method 1: WP Rocket integration
- Go to WP Rocket → CDN
- Enable CDN
- Enter your CDN CNAME(s):
- Cloudflare: Your domain (already using Cloudflare DNS)
- BunnyCDN:
yoursite.b-cdn.net
- Save changes
WP Rocket automatically rewrites all static file URLs to use CDN.
Method 2: Manual CDN integration
Add to wp-config.php:
// Define CDN URL
define('WP_CONTENT_URL', 'https://yoursite.b-cdn.net/wp-content');
define('WPINC', 'https://yoursite.b-cdn.net/wp-includes');
Or use CDN Enabler plugin for more control.
Step 5: Verify CDN is working
Test #1: Check response headers
- Open your site
- Right-click → Inspect → Network tab
- Reload page
- Click any CSS/JS/image file
- Check Headers → Response Headers
- Look for:
cf-cache-status: HIT(Cloudflare)x-cache: HIT(BunnyCDN)server: cloudflareor similar
Test #2: Check file URLs
View page source (Ctrl+U) and verify static files use CDN:
<!-- BEFORE CDN -->
<link rel="stylesheet" href="https://yoursite.com/wp-content/themes/theme/style.css">

<!-- AFTER CDN -->
<link rel="stylesheet" href="https://yoursite.b-cdn.net/wp-content/themes/theme/style.css">
Test #3: Geographic speed test
Use tools.keycdn.com/performance to test from multiple locations worldwide.
Should show consistent fast loading across all regions.
Expected CDN performance improvement:
Before CDN (tested from various locations):
- USA (near server): 1.2 seconds
- Europe: 3.8 seconds
- Asia: 4.5 seconds
- Australia: 5.2 seconds
- Average: 3.7 seconds

After CDN:
- USA: 1.2 seconds (same)
- Europe: 1.4 seconds (73% faster)
- Asia: 1.6 seconds (64% faster)
- Australia: 1.5 seconds (71% faster)
- Average: 1.4 seconds (62% faster globally)
Phase 6: Hosting & Server Optimization
Your hosting is your performance foundation. All previous optimizations hit a ceiling on poor hosting.
Step 1: Audit current hosting performance
Check these critical metrics:
Server response time (TTFB):
- Excellent: < 200ms
- Good: 200-500ms
- Poor: 500-1000ms
- Critical: > 1000ms

PHP version:
- Modern: 8.0, 8.1, 8.2
- Acceptable: 7.4
- Outdated: 7.3 or older (security risk + slow)

Available resources:
- RAM: Check in hosting control panel
- CPU: Check current usage
- Database: MySQL 5.7+ or MariaDB 10.3+

Uptime:
- Acceptable: 99.9% (8.76 hours downtime/year)
- Poor: 99% (3.65 days downtime/year)
How to check your PHP version:
Dashboard → Site Health → Info → Server:
PHP Version: 8.2.0 ✓ GOOD
PHP Version: 7.3.0 ✗ BAD (upgrade immediately)
Step 2: Upgrade PHP version
Modern PHP is 40-60% faster than old versions.
PHP performance comparison:
| PHP Version | Requests/Second | Speed vs 7.0 |
|---|---|---|
| PHP 5.6 | 90 | -50% |
| PHP 7.0 | 180 | Baseline |
| PHP 7.4 | 300 | +67% |
| PHP 8.0 | 370 | +106% |
| PHP 8.1 | 380 | +111% |
| PHP 8.2 | 390 | +117% |
How to upgrade PHP:
Most hosts allow PHP version selection:
cPanel:
1. Log into cPanel
2. Find "Select PHP Version" or "MultiPHP Manager"
3. Select PHP 8.0 or higher
4. Click Apply

Managed WordPress hosts:
1. Contact support
2. Request PHP upgrade to 8.x
3. They handle it (usually same day)
Before upgrading, test compatibility:
Install PHP Compatibility Checker plugin:
- Activate plugin
- Go to Tools → PHP Compatibility
- Select PHP 8.0
- Click “Scan Site”
- Review any incompatibilities
- Update incompatible plugins/themes before upgrading
Step 3: Enable OPcache
OPcache stores compiled PHP code in memory, eliminating recompilation on every request.
Performance impact: 40-60% faster PHP execution.
Check if OPcache is enabled:
Dashboard → Site Health → Info → Server → Look for “OPcache”
Enable OPcache:
Most modern hosts enable it by default. If not:
Add to php.ini (contact host if you can’t access):
opcache.enable=1
opcache.memory_consumption=256
opcache.interned_strings_buffer=16
opcache.max_accelerated_files=10000
opcache.revalidate_freq=2
opcache.fast_shutdown=1
Step 4: Optimize MySQL/MariaDB
Database configuration affects query performance.
Check current database version:
In phpMyAdmin or via hosting panel:
MySQL 5.7+ ✓ Good
MySQL 8.0+ ✓ Excellent
MariaDB 10.3+ ✓ Good
MariaDB 10.5+ ✓ Excellent

MySQL 5.6 or older ✗ Upgrade needed
Database optimization settings:
Most hosting doesn’t let you modify these directly, but you can request them from support:
-- Add indexes to commonly queried columns
ALTER TABLE wp_posts ADD INDEX idx_post_status_date (post_status, post_date);

-- Check for missing indexes
SELECT * FROM information_schema.TABLES
WHERE TABLE_SCHEMA = 'your_database_name';
Step 5: Consider upgrading hosting
If you’ve optimized everything and still see:
- TTFB over 800ms
- Can’t upgrade PHP past 7.4
- Regular downtime or slowdowns
- No OPcache or server-level caching
It’s time to upgrade hosting.
Hosting comparison for WordPress:
| Hosting Type | Speed | Monthly Cost | Best For |
|---|---|---|---|
| Cheap shared | Poor | $3-10 | Testing only |
| Quality shared | Good | $10-25 | Small sites, blogs |
| Managed WordPress | Excellent | $25-80 | Business sites |
| VPS/Cloud | Excellent | $20-100+ | High traffic, custom needs |
| Dedicated | Excellent | $100-500+ | Enterprise sites |
Recommended managed WordPress hosts:
SiteGround ($25-80/month)
Pros:
✓ Excellent support (24/7)
✓ Good performance
✓ Daily backups included
✓ Free CDN (Cloudflare)
✓ Staging environments
✓ Custom caching

Best for: Small to medium businesses, growing sites
Kinsta ($35-300+/month)
Pros:
✓ Google Cloud infrastructure
✓ Outstanding performance
✓ Enterprise-grade security
✓ Hack fix guarantee
✓ Automatic daily backups
✓ Built-in CDN

Best for: High-performance sites, e-commerce, agencies
WP Engine ($30-290+/month)
Pros:
✓ Industry leader
✓ Excellent performance
✓ Developer-friendly tools
✓ Staging environments
✓ Automated migrations
✓ Strong security

Best for: Agencies, developers, enterprise clients
Cloudways ($10-80/month)
Pros:
✓ Flexible cloud hosting (AWS, Google Cloud, DigitalOcean)
✓ Excellent value
✓ Good performance
✓ Scalable resources
✓ Developer features

Best for: Growing sites, developers, budget-conscious businesses
Migration services: Most quality hosts offer free migration assistance.
Expected improvement after hosting upgrade:
Before (cheap shared hosting):
- TTFB: 1,800ms
- PHP 7.2
- No OPcache
- Load time: 4.2 seconds

After (managed WordPress hosting):
- TTFB: 250ms (86% faster)
- PHP 8.2
- OPcache enabled
- Load time: 1.2 seconds (71% faster)
Phase 7: Plugin Audit & Replacement
Plugins are necessary but often bloated. Strategic replacement delivers major performance gains.
Step 1: Inventory current plugins
Create a spreadsheet listing:
Plugin Name | Purpose | Last Updated | Active Installs | Load Impact
-----------------------------------------------------------------------
Plugin A    | SEO     | 2 weeks ago  | 5M+            | Low
Plugin B    | Forms   | 6 months ago | 500K           | High
Plugin C    | Social  | 1 year ago   | 100K           | High
Step 2: Identify performance-killing plugins
Use Query Monitor (from Phase 1) to find plugins causing:
- 20+ database queries per page
- Load times over 0.5 seconds
- Excessive HTTP requests
Common performance-killing plugin types:
Page Builders (heavy JavaScript/CSS)
Slow options:
✗ Visual Composer (bloated, outdated)
✗ Divi (feature-rich but heavy)
✗ Beaver Builder (moderate performance)

Fast alternatives:
✓ Gutenberg (native, lightweight)
✓ GenerateBlocks (lightweight Gutenberg extension)
✓ Oxygen Builder (if you need visual builder)
Contact Forms
Slow options:
✗ Contact Form 7 (loads CSS/JS on all pages)
✗ Ninja Forms (feature-rich but heavy)

Fast alternatives:
✓ WPForms Lite (optimized, conditional loading)
✓ Fluent Forms (lightweight, modern)
✓ Simple HTML form (no plugin needed!)
SEO Plugins
Acceptable options:
✓ Yoast SEO (standard but optimizable)
✓ Rank Math (feature-rich but can be heavy)
✓ SEOPress (lighter than others)

Note: You only need ONE SEO plugin. Multiple SEO plugins destroy performance.
Related Posts Plugins
Slow options:
✗ Yet Another Related Posts Plugin (YARPP) - database intensive
✗ Most related posts plugins

Fast alternatives:
✓ Native WordPress block patterns
✓ Manual related posts selection
✓ Lightweight alternatives: Related Posts by Taxonomy
Social Sharing
Slow options:
✗ AddThis (loads external scripts)
✗ ShareThis (privacy issues + slow)
✗ Social Warfare (discontinued)

Fast alternatives:
✓ Simple Social Icons (lightweight)
✓ Native social links (just icon + URL)
✓ Novashare (optimized specifically for speed)
Step 3: Replace slow plugins systematically
Never replace multiple plugins at once. Replace one, test thoroughly, then proceed.
Replacement process:
1. Test current performance (record baseline)
2. Deactivate slow plugin
3. Install alternative
4. Configure and test functionality
5. Test performance (compare to baseline)
6. If better: delete old plugin completely
7. If worse: revert and try different alternative
8. Repeat for next plugin
Step 4: Eliminate unnecessary plugins
Common plugins you probably don’t need:
✗ Multiple caching plugins (only need one)
✗ Multiple SEO plugins (only need one)
✗ Broken link checkers (run occasionally, not 24/7)
✗ Related posts (can do manually)
✗ Social share counters (vanity metrics + slow APIs)
✗ Too many analytics plugins (use one + Google Analytics)
✗ Demo content importers (delete after import)
✗ Migration plugins (delete after migration)
The plugin minimalism test:
Ask for each plugin:
- Do I actively use this feature weekly?
- Can I accomplish this with code instead?
- Does this directly impact conversions/revenue?
- Would visitors notice if it was gone?
If “no” to all four, delete it.
Step 5: Optimize remaining plugins
For plugins you must keep:
Disable unused plugin features:
Many plugins include unnecessary features consuming resources.
Example – Yoast SEO optimization:
Yoast SEO → General → Features:
✓ SEO analysis (keep - essential)
✓ Readability analysis (keep - useful)
✗ Cornerstone content (disable - rarely used)
✗ Text link counter (disable - unnecessary)
✗ Insights (disable - uses resources)
✗ Link suggestions (disable - external API calls)
Configure plugins to load only where needed:
Use Asset CleanUp to disable plugin assets on pages where not needed:
Example: WooCommerce
- Load on: Shop, product pages, cart, checkout
- DON'T load on: Blog posts, about page, contact page

Example: Contact Form 7
- Load on: Contact page only
- DON'T load on: All other pages
Expected results after plugin optimization:
Before plugin audit:
- Active plugins: 28
- Database queries: 147 per page
- Page load time: 4.8 seconds
- HTTP requests: 89

After plugin optimization:
- Active plugins: 12 (57% reduction)
- Database queries: 42 per page (71% reduction)
- Page load time: 1.6 seconds (67% faster)
- HTTP requests: 38 (57% reduction)
Common Speed Optimization Mistakes That Make Things Worse
Avoid these pitfalls that destroy performance instead of improving it.
Mistake #1: Installing Multiple Caching Plugins
The problem:
Users think more caching = better performance. They install WP Rocket + W3 Total Cache + WP Super Cache simultaneously.
What actually happens:
Multiple caching plugins conflict:
├── Plugin A caches page
├── Plugin B tries to cache already-cached page
├── Plugin C tries to cache Plugin B's cache
├── Conflicts cause errors
├── Cache invalidation breaks
└── Site slower than before (or breaks completely)
The fix: Use ONE caching plugin. Delete all others completely (not just deactivate).
Mistake #2: Over-Aggressive Image Compression
The problem:
Compressing images to 20-30 KB makes them tiny in file size but destroys visual quality.
Impact:
Before: 800 KB image, excellent quality
Over-compressed: 25 KB image, pixelated and blurry

Result:
✓ Faster load time
✗ Unprofessional appearance
✗ Visitors lose trust
✗ Conversions decrease
✗ Net negative impact on business
The fix: Compress until quality remains excellent. Target 100-300 KB for photos while maintaining visual fidelity.
Mistake #3: Deleting Plugins Without Testing
The problem:
Deleting plugins blindly without understanding dependencies breaks site functionality.
Example disaster:
User deletes "unused" Classic Editor plugin
↓
Doesn't realize contact form depends on it
↓
All contact forms break sitewide
↓
Panic, no backup available
↓
Loses leads while frantically trying to fix
The fix:
- Always backup before deleting plugins
- Deactivate first, test site for 48 hours
- If everything works, delete completely
- Have staging site for testing major changes
Mistake #4: Ignoring Mobile Performance
The problem:
Optimizing only for desktop when 60-70% of traffic is mobile.
Reality check:
Desktop performance: 1.2 seconds ✓
Mobile performance: 8.5 seconds ✗

Result: 70% of visitors have terrible experience
The fix:
Always test on real mobile devices:
- Test on actual smartphones
- Use Chrome DevTools mobile simulation
- Check PageSpeed Insights mobile score
- Test on slow 3G connection simulation
Mistake #5: Set-It-And-Forget-It Mentality
The problem:
Optimizing once in 2023, never touching it again in 2024-2025.
What happens over time:
Month 1: Site optimized, 1.2s load time
Month 3: New plugins added, 2.1s load time
Month 6: Database bloated, 3.4s load time
Month 12: Images piling up, 5.8s load time

Performance decay: 383% slower in one year
The fix:
Maintain quarterly optimization schedule:
- Monthly: Check Core Web Vitals, remove unused plugins
- Quarterly: Full performance audit, database cleanup
- Annually: Consider hosting upgrade, major optimization review
Mistake #6: Cheap Hosting + Premium Optimization
The problem:
Spending $500 on premium optimization plugins while using $3/month hosting.
The reality:
$3/month hosting limitations:
- Maximum PHP 7.2 (no upgrade available)
- 512 MB RAM shared across 500 sites
- Ancient MySQL 5.5
- No OPcache support
- Frequent downtime

Result: Premium plugins can't overcome terrible infrastructure
The fix: Invest in quality hosting before expensive optimization plugins. $25/month quality hosting delivers more performance than $3/month hosting + $100 in optimization tools.
Mistake #7: Blindly Following All Recommendations
The problem:
Implementing every Lighthouse suggestion without understanding impact.
Example:
Lighthouse says: "Remove unused CSS"
User installs plugin that removes ALL CSS
Site loads fast but looks completely broken
The fix: Understand what each optimization does before implementing. Test after each change. Some recommendations conflict with design/functionality requirements.
When to Get Professional WordPress Speed Optimization
DIY optimization works for many sites. But professional help makes sense when:
You Need Guaranteed Results
DIY risk:
Your optimization attempts:
- Week 1: Install caching plugin → site breaks
- Week 2: Try different caching → conflicts with theme
- Week 3: Optimize images → quality too low
- Week 4: Still slow, frustrated, wasted time

Result: 4 weeks wasted, site still slow
Professional service:
Expert optimization:
- Day 1: Complete audit identifies exact issues
- Day 2: Systematic optimization with testing
- Day 3: Verified 60% speed improvement
- Money-back guarantee if no measurable improvement

Result: Problem solved in 72 hours, guaranteed
Your Site is Mission-Critical
When stakes are too high for experimentation:
E-commerce site doing $50,000/month:
- Every day of slow performance costs $1,200 in lost sales
- Can't afford downtime from broken optimization
- Need expert implementation done right first time
- ROI on professional service: Pays for itself in 2 days
You Lack Technical Expertise
Technical requirements for advanced optimization:
- Understanding PHP, MySQL, server configuration
- Reading performance reports and waterfalls
- Editing .htaccess and wp-config.php safely
- Debugging plugin conflicts
- Command line experience for advanced tools
If these skills are outside your wheelhouse, professional optimization prevents costly mistakes.
You’ve Hit the DIY Ceiling
Signs you need expert help:
✗ Implemented all basic optimizations
✗ Still failing Core Web Vitals
✗ Load time still over 4 seconds
✗ Bounce rate still climbing
✗ Don't know what else to try
✗ Every change makes things worse
Advanced optimization requires server-level configuration, custom code optimization, and expertise beyond plugin installation.
What Professional WordPress Speed Optimization Delivers
Complete Performance Diagnosis
Deep technical audit revealing:
- Exact bottlenecks prioritized by impact
- Database analysis with query optimization
- Server configuration review
- Plugin performance profiling
- Code-level inefficiencies
- CDN and caching analysis
Expert Implementation
Professional optimization includes:
Server-level optimization:
- PHP version upgrade and configuration
- OPcache implementation
- MySQL query optimization
- .htaccess optimization
- GZIP/Brotli compression
- HTTP/2 and HTTP/3 enablement
Advanced caching strategies:
- Multi-layer caching (page, object, database)
- CDN integration and configuration
- Browser caching optimization
- Preloading and prefetching
- Cache warming for high-traffic sites
Code optimization:
- Critical CSS extraction
- JavaScript optimization and deferral
- Database query optimization
- Custom code minification
- Removal of render-blocking resources
Image optimization:
- Bulk compression and format conversion
- WebP/AVIF implementation
- Lazy loading configuration
- Responsive image setup
- Proper dimension optimization
Guaranteed Measurable Results
Typical professional optimization improvements:
Before professional optimization:
- PageSpeed Insights score: 32/100
- Load time: 6.8 seconds
- Core Web Vitals: All failing
- LCP: 5.8 seconds
- INP: 650ms
- CLS: 0.42

After professional optimization:
- PageSpeed Insights score: 92/100 (187% improvement)
- Load time: 1.4 seconds (79% faster)
- Core Web Vitals: All passing
- LCP: 1.2 seconds (79% faster)
- INP: 95ms (85% faster)
- CLS: 0.04 (90% improvement)
Money-back guarantee: If no measurable improvement, full refund.
Ongoing Support & Monitoring
Professional services include:
- Before/after performance reports
- Documentation of all changes made
- 30-90 day performance monitoring
- Priority support if issues arise
- Guidance for maintaining performance
- Quarterly check-ins (premium plans)
Time Savings
DIY optimization timeline:
Week 1: Research and planning (10 hours)
Week 2: Implementation and testing (15 hours)
Week 3: Debugging and fixing broken features (12 hours)
Week 4: Additional optimization attempts (8 hours)

Total: 45+ hours of your time
Success rate: 60-70% chance of significant improvement
Professional optimization:
Day 1: Complete in 24-48 hours
Your time investment: 30 minutes (consultation)
Success rate: 95%+ guaranteed improvement
Value calculation:
Your hourly rate: $50/hour
DIY time investment: 45 hours × $50 = $2,250 of your time
Professional service cost: $150-$500
Time savings value: $1,750-$2,100
Plus guaranteed results
Real Client Results: Before & After Optimization
E-Commerce Site: $78K Annual Revenue Increase
Starting point:
- Load time: 7.2 seconds
- Mobile load: 11.8 seconds
- PageSpeed score: 28/100
- Monthly revenue: $42,000
- Mobile conversion: 1.8%
After optimization:
- Load time: 1.6 seconds (78% faster)
- Mobile load: 2.4 seconds (80% faster)
- PageSpeed score: 94/100
- Monthly revenue: $48,500 (+15%)
- Mobile conversion: 2.8% (+56%)
Annual impact: Additional $78,000 revenue from speed improvement alone.
Service Business: 165% Lead Increase
Starting point:
- Load time: 5.8 seconds
- Core Web Vitals: All failing
- Monthly leads: 94
- Bounce rate: 76%
After optimization:
- Load time: 1.3 seconds (78% faster)
- Core Web Vitals: All passing
- Monthly leads: 249 (+165%)
- Bounce rate: 41% (46% improvement)
Impact: 155 additional monthly leads = 1,860 leads/year
High-Traffic Blog: 285% Traffic Increase
Starting point:
- Load time: 4.9 seconds
- Google rankings: Page 2-3 average
- Monthly visitors: 45,000
- Pages per session: 1.4
After optimization:
- Load time: 1.1 seconds (78% faster)
- Google rankings: Page 1 average (moved up 8-12 positions)
- Monthly visitors: 173,000 (+285%)
- Pages per session: 3.2 (+129%)
Impact: Speed improvements led to ranking increases, which multiplied organic traffic.
Your WordPress Speed Optimization Action Plan
Immediate Actions (Do Today)
Hour 1: Audit current performance
1. Run PageSpeed Insights: [Your score: ___]
2. Check GTmetrix: [Load time: ___]
3. Review Google Search Console Core Web Vitals
4. Document top 3 issues identified
Hour 2: Quick wins
1. Delete unused plugins (target: remove 5-10)
2. Update WordPress core, themes, plugins
3. Install and configure caching plugin
4. Enable lazy loading for images
Expected immediate improvement: 20-30% faster after these quick fixes.
Week 1: Systematic Optimization
Day 1-2: Image optimization
- Install ShortPixel or Imagify
- Bulk optimize existing images
- Set up automatic compression for new uploads
Day 3-4: Caching implementation
- Configure caching plugin properly
- Set up CDN (Cloudflare free tier)
- Test and verify caching works
Day 5-7: Code optimization
- Enable minification (CSS/JavaScript)
- Implement defer/async JavaScript
- Remove unused CSS/JS with Asset CleanUp
Expected improvement: 40-60% faster load times.
Week 2: Advanced Optimization
Database cleanup:
- Install WP-Optimize
- Clean revisions, transients, spam
- Schedule automatic weekly cleanup
Plugin audit:
- Profile plugins with Query Monitor
- Replace 2-3 slowest plugins
- Delete unnecessary plugins
Hosting assessment:
- Upgrade PHP to 8.0+
- Verify OPcache enabled
- Consider hosting upgrade if TTFB > 800ms
Expected improvement: 50-70% faster than starting point.
Ongoing Maintenance
Monthly tasks (30 minutes):
□ Check Core Web Vitals in Search Console
□ Run performance test (PageSpeed Insights)
□ Review and remove unused plugins
□ Check for theme/plugin updates
□ Monitor site uptime and speed
Quarterly tasks (2 hours):
□ Full performance audit with multiple tools
□ Database cleanup and optimization
□ Review hosting performance metrics
□ Update optimization configurations
□ Test site speed from multiple devices/locations
Annual tasks (4 hours):
□ Comprehensive performance audit
□ Evaluate hosting provider performance
□ Review and update optimization strategy
□ Consider major upgrades (hosting, CDN, tools)
□ Archive and clean old content/media
WordPress Speed Optimization Checklist
Save this comprehensive checklist and work through systematically.
✅ Performance Audit Checklist
□ Run Google PageSpeed Insights (mobile + desktop)
□ Test with GTmetrix
□ Check WebPageTest from multiple locations
□ Review Google Search Console Core Web Vitals
□ Document current scores and load times
□ Identify top 5 performance bottlenecks
□ Prioritize fixes by impact
✅ Database Optimization Checklist
□ Backup database before any changes
□ Delete post revisions (limit future to 3-5)
□ Remove expired transients
□ Delete spam and trashed comments
□ Clean orphaned postmeta
□ Remove orphaned term relationships
□ Optimize all database tables
□ Schedule automatic weekly cleanup
□ Verify database version (MySQL 5.7+ or MariaDB 10.3+)
✅ Image Optimization Checklist
□ Install image optimization plugin (ShortPixel/Imagify)
□ Configure compression settings (Lossy recommended)
□ Enable WebP conversion
□ Bulk optimize existing images
□ Set up lazy loading
□ Implement responsive images (srcset)
□ Resize large images to max 2000px width
□ Set proper image dimensions in HTML
□ Remove EXIF data from images
□ Configure automatic optimization for new uploads
✅ Caching Optimization Checklist
□ Install caching plugin (WP Rocket/W3 Total Cache/LiteSpeed)
□ Enable page caching
□ Enable browser caching
□ Configure cache expiration (7-30 days)
□ Enable GZIP/Brotli compression
□ Set up cache preloading
□ Configure mobile-specific caching
□ Exclude dynamic pages (cart, checkout, my-account)
□ Test cache is working properly
□ Clear cache after major changes
✅ CDN Implementation Checklist
□ Choose CDN provider (Cloudflare/BunnyCDN)
□ Sign up and configure account
□ Update DNS settings (if using Cloudflare)
□ Configure CDN zones
□ Integrate CDN with WordPress (via plugin or manual)
□ Enable CDN for images, CSS, JS
□ Configure CDN caching rules
□ Enable Brotli compression on CDN
□ Test CDN is serving files
□ Verify geographic performance improvement
✅ Code Optimization Checklist
□ Minify CSS files
□ Minify JavaScript files
□ Combine CSS files (test for conflicts)
□ Defer non-critical JavaScript
□ Implement critical CSS
□ Remove unused CSS
□ Remove unused JavaScript
□ Eliminate render-blocking resources
□ Reduce JavaScript execution time
□ Optimize web fonts (font-display: swap)
□ Preload critical resources
✅ Hosting & Server Checklist
□ Check current TTFB (target: <300ms)
□ Verify PHP version (upgrade to 8.0+)
□ Enable OPcache
□ Optimize MySQL/MariaDB
□ Enable HTTP/2 or HTTP/3
□ Configure proper file permissions
□ Enable keep-alive connections
□ Reduce server response time
□ Consider hosting upgrade if needed
□ Implement server-level caching
✅ Plugin Optimization Checklist
□ Inventory all active plugins
□ Profile plugins with Query Monitor
□ Delete unused/unnecessary plugins
□ Replace slow plugins with faster alternatives
□ Disable unused plugin features
□ Configure plugins to load only where needed
□ Limit to ONE caching plugin
□ Limit to ONE SEO plugin
□ Update all plugins to latest versions
□ Remove nulled/pirated plugins
✅ Mobile Optimization Checklist
□ Test mobile performance (PageSpeed Insights mobile)
□ Enable mobile-specific caching
□ Optimize images for mobile (smaller sizes)
□ Test on real mobile devices
□ Check mobile Core Web Vitals
□ Reduce mobile-specific render-blocking
□ Implement mobile-friendly navigation
□ Test on slow 3G connection
✅ Monitoring & Maintenance Checklist
□ Set up uptime monitoring
□ Configure performance monitoring
□ Schedule monthly performance checks
□ Set up alerts for downtime
□ Review performance reports monthly
□ Document all optimization changes
□ Maintain optimization documentation
□ Schedule quarterly deep audits
Conclusion: Speed Is Your Competitive Advantage
WordPress speed isn’t just about technical metrics. It’s about revenue, rankings, and user experience.
The compounding effects of fast sites:
Fast Site Benefits:
├── Google ranks you higher
│   └── More organic traffic
│       └── More leads and customers
├── Visitors stay longer
│   └── Lower bounce rates
│       └── Better engagement signals
│           └── Even better rankings
├── Conversions increase
│   └── More revenue per visitor
│       └── Better ROI on all traffic sources
└── Professional brand perception
    └── Customer trust and loyalty
        └── Word-of-mouth referrals
The devastating cost of staying slow:
Slow Site Consequences:
├── Google penalizes you
│   └── Rankings drop
│       └── Traffic decreases 40-60%
├── Visitors bounce immediately
│   └── 53% abandon if >3 seconds
│       └── Lost leads and sales
├── Mobile users suffer most
│   └── 70% of traffic frustrated
│       └── Revenue collapses
└── Competitors steal market share
    └── Your customers go elsewhere
        └── Revenue never recovers
Your competitors are optimizing right now. Every day you delay:
- They gain ranking positions above you
- They capture traffic you should have
- They convert customers you’re losing
- The gap widens further
Most WordPress sites can achieve:
- 50-70% faster load times through systematic optimization
- 40-60% improvement in Core Web Vitals scores
- 20-40% increase in conversion rates from speed alone
- Significant ranking improvements within 30-60 days
Take Action Now: Get Your Site Optimized
DIY Optimization Path
Best for: Small sites, blogs, those comfortable with technical work
Start here:
- Work through this guide systematically
- Follow the action plan step-by-step
- Use the comprehensive checklist
- Test after each major change
- Document your improvements
Timeline: 2-4 weeks for complete optimization Cost: $0-50 for plugins/tools Success rate: 60-70% achieve significant improvement
Professional Optimization Service
Best for: Business sites, e-commerce, mission-critical sites, those wanting guaranteed results
What you get:
- Complete performance diagnosis
- Expert implementation of all optimizations
- Server-level configuration
- Advanced caching strategies
- Code optimization
- Guaranteed measurable results
- 30-90 day support
- Money-back guarantee
Timeline: 24-72 hours for complete optimization Typical results: 60-80% faster load times guaranteed ROI: Usually pays for itself within 2-7 days from improved conversions
Get WordPress Speed Optimization Now
Is your WordPress site slow and costing you traffic, rankings, and revenue?
Get expert speed optimization that:
Get Professional WordPress Speed Optimization →
Same-day service available. Measurable results guaranteed. Full ongoing support included.